
Insights
Explore and visualize the data behind your business
Neon provides data visualizations aggregating data from event and transaction sources to help answer a range of business questions.
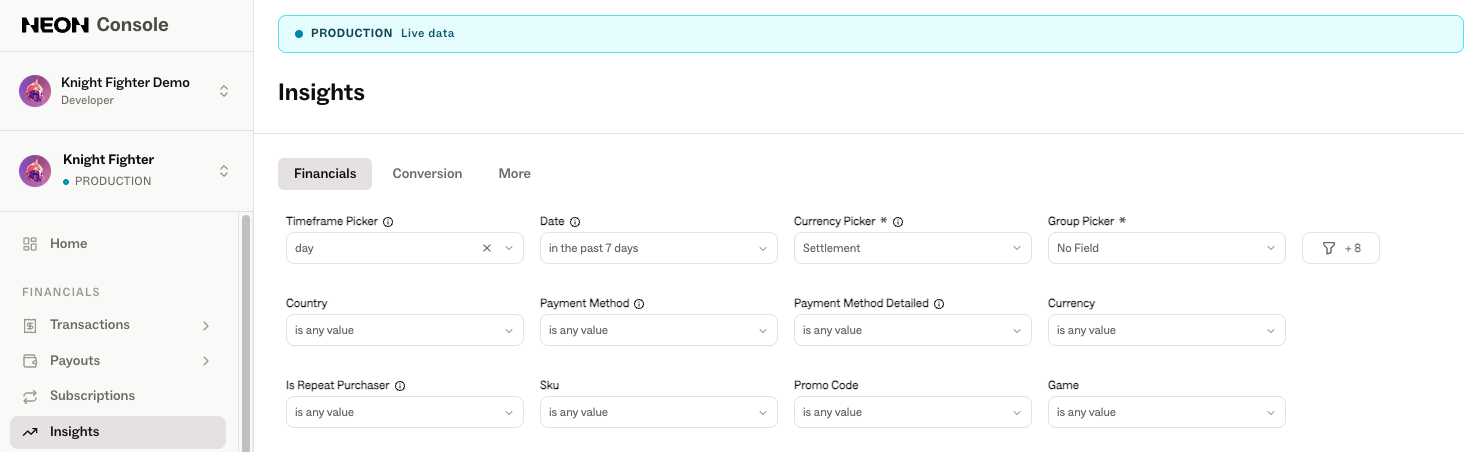
These metrics can be explored flexibly over various timeframes and aggregated across groups such as Country, Payment Method, Currency, and Game.
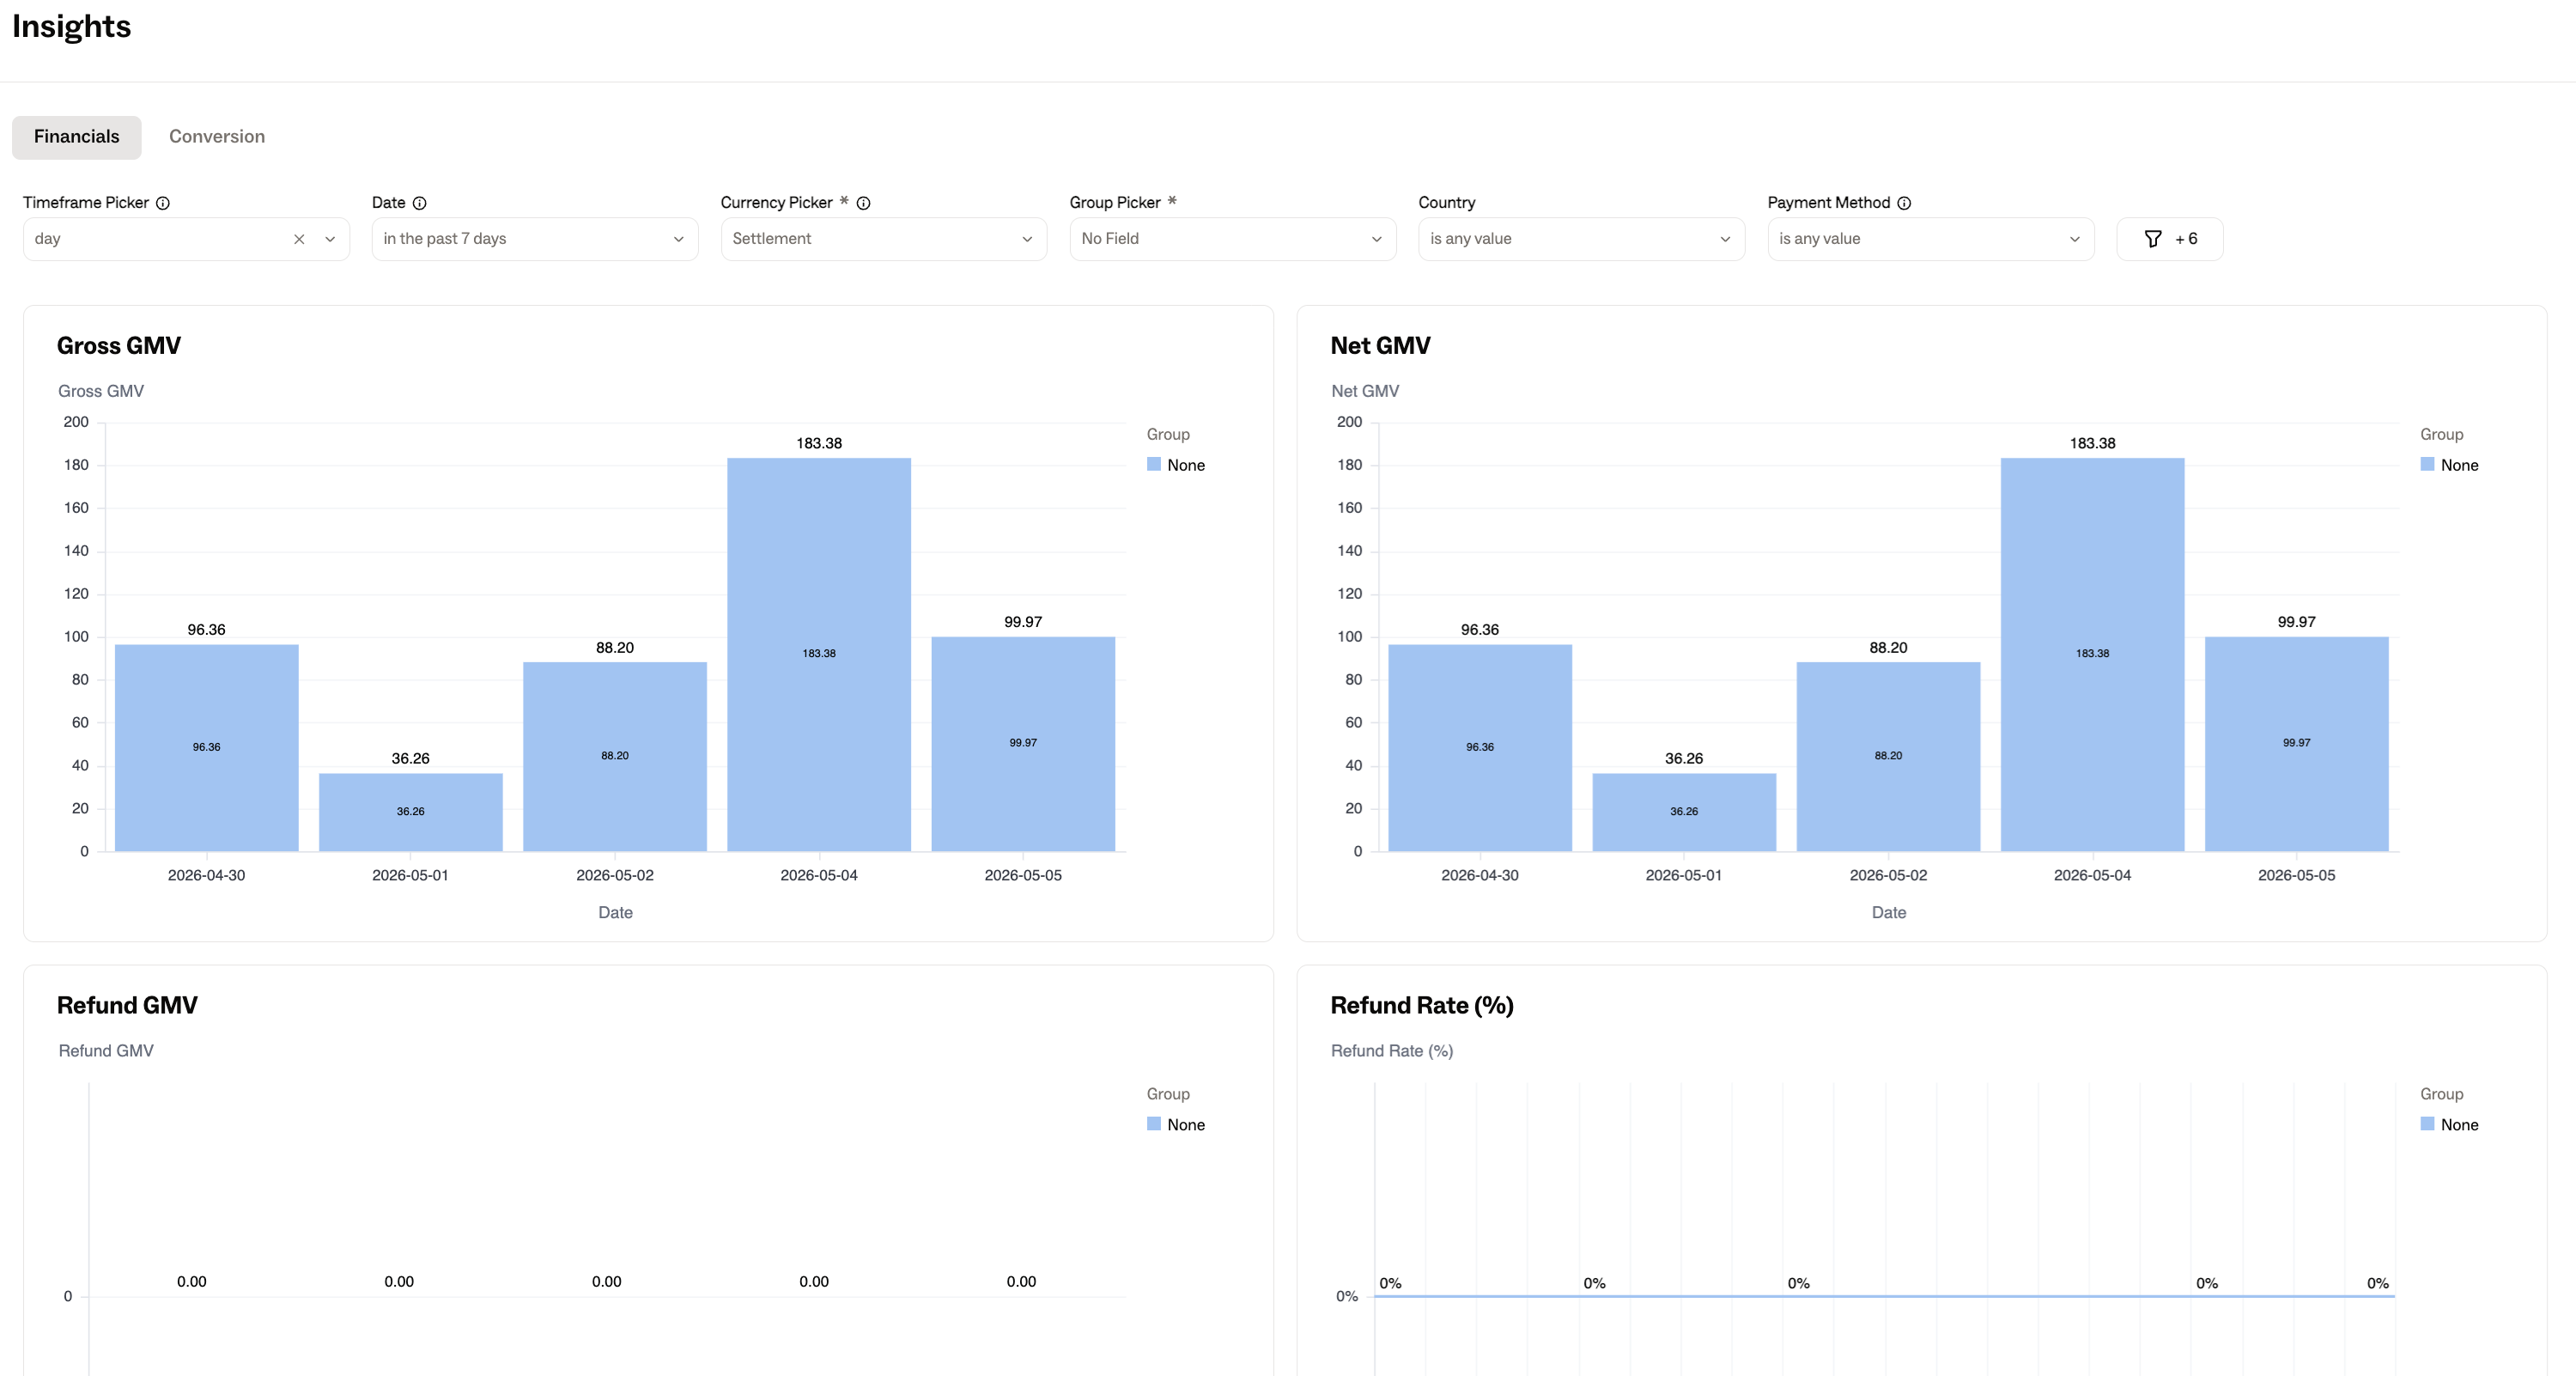
Some key revenue metrics include (but are not limited to):
- Gross GMV
- Net GMV
- Refund, Chargeback, Discount GMV
- Tax Amounts
- Fee Amounts
Conversion data includes (but is not limited to):
- Storefront Opens
- Checkout Conversion Rate
- PSR (Payment Success Rate)
- Free and Paid Purchase Counts
Risk indicators such as Dispute Rate and Chargeback Rate are also displayed.
Export analytical and player behavior dataLearn how to export Neon Shop and Checkout analytics data for your reporting, BI tools, or internal data pipeline.
→